Auto Dealer’s Guide to PageSpeed Insights
Alex Griffis May 31, 2024

What is PageSpeed Insights, and why are dealerships talking about Core Web Vitals?
PageSpeed Insights is a free service that analyzes website performance (specifically, Core Web Vitals) on desktop and mobile. It provides a summarized report of website issues with recommendations on how to solve them. As a mobile-first website provider, we closely monitor PageSpeed Insights to ensure the best user experience possible. Our real-time analytics show over 80% of car shopping originates from a mobile device, and it’s increasing year over year, so the Core Web Vitals Assessment provided by PageSpeed helps us identify:
- Which third-party plugins are having the most significant impact on your website speed and your visitors’ experience
- Uncompressed or unoptimized images, videos, etc., that are slowing the page speeds
- Website provider-specific issues like latency, lack of mobile responsiveness, etc.
Take the Performance score with a grain of salt; it’s a red herring.
Website providers often rely on the Performance score to pitch a specific narrative about PageSpeed scores, but this is misleading. To truly understand PageSpeed reports and interpret the data correctly, it’s important to distinguish between the Performance score (the big red circle in the middle of the screen) and the Core Web Vitals Assessment (at the very top of the page and the most important but most often overlooked).
The report that actually matters: Core Web Vitals Assessment
The Core Web Vitals Assessment shows how your website performs, on average and over time, based on the experiences of real-life website visitors. The Assessment score is based on Google Chrome’s User Experience Report (or “CrUX” for short), a dataset that accurately reflects the real-world user’s experience with your website. This is often called “field” data, whereas the Performance score is called “lab” data. The CrUX data set is a rolling 28-day average that is much more accurate than an individual snapshot in time:
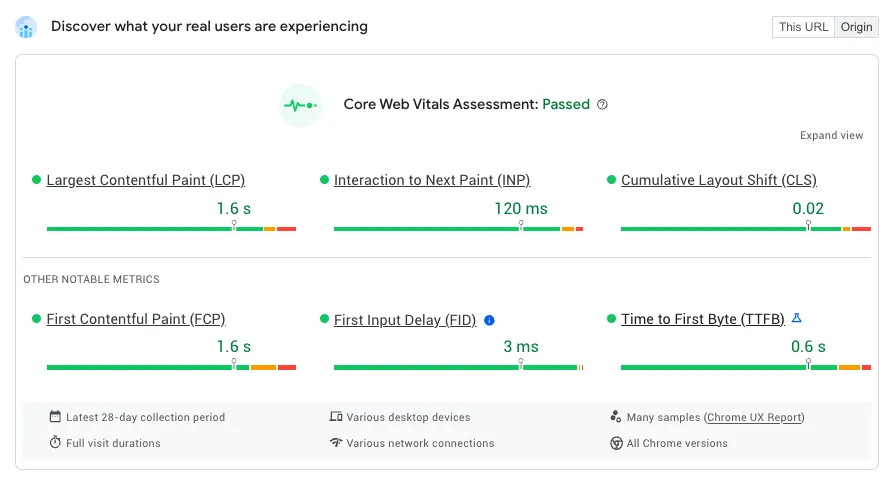
If your Core Web Vitals Assessment is solid, it’s likely not worth getting distracted by an unreliable performance score. However, if a dealership fails both, it should ask its website vendor how it plans to address the performance issues. Since Core Web Vitals arrived on the scene in 2020, adoption of best performance practices has gained little momentum in automotive, and dealerships are feeling that pain through worse search engine rankings, higher pay-per-click costs, and lower conversion rates.
The PageSpeed Performance score is based on “lab” data.
In other words, the Performance score isn’t based on real-life visitors. A product expert from Google referred to lab testing data as an attempt at a realistic test but data that will “never capture real-world nuances.” You can see this phenomenon in action by running several PageSpeed tests back-to-back. If the scores change or vary somewhat dramatically, as they often do, it’s hard to trust the score or test if your website improvements are making a difference.
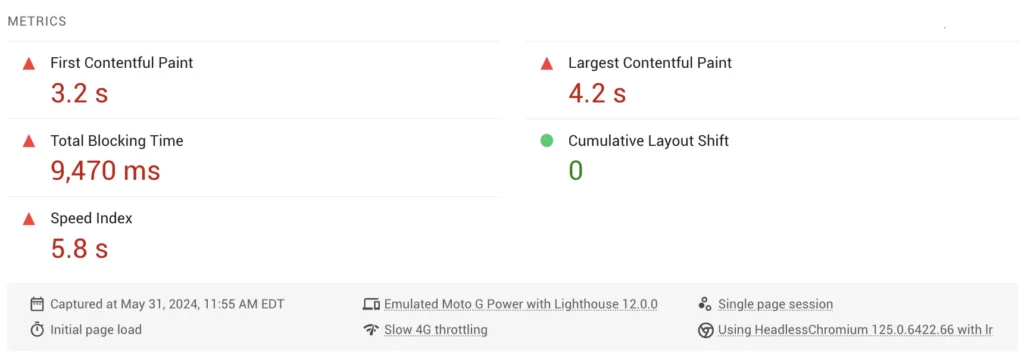
The second issue with lab data is its simulation using a slow 4G phone connection. While 60% of phones are still connected to 4G networks, this needs to account for personal WiFi or the broad use of public WiFi networks. If the Performance score accurately reflected your visitor base, you would have a failing Core Web Vitals Assessment.
Interpreting a Core Web Vitals Assessment: “This URL” versus “Origin”
A PageSpeed Insights report has two assessments: “This URL” and “Origin.” The common practice is to paste in a homepage URL and run a report. It may seem like the obvious thing to do, but in the case of automotive dealerships, the homepage often isn’t the biggest recipient of traffic compared to the search results page (SRP) or vehicle pages (VDP).
This is why we focus on the “Origin” tab of the report, which often gets overlooked – it assesses the Core Web Vitals Assessment across ALL URLs originating from a dealership’s web address. It demonstrates how one bad page on a website can bring down the entire website’s performance. How does this happen? Here are a couple of real-life scenarios we’ve encountered:
- A dealership hired a photographer to take photos of the team. Rather than resizing the images and optimizing them, the full-resolution photos were uploaded to the staff page. It increased the size of the page by 3,000%, causing a Core Web Vitals failure. The page became so slow it brought down the average performance of the website as a whole.
- A dealership signed up for a digital retailing plugin that injected calls to action (CTAs) onto its vehicle pages. The calls to action jumbled up the page and caused a massive layout shift. As a result, the dealership started failing the Cumulative Layout Shift (“CLS”) web vital on its highest-traffic pages.
- A dealer group produced drone footage highlighting their locations and dropped it, unedited and unoptimized, into the center of their homepage. Don’t get us wrong; the video was excellent, but it increased the homepage size by 900%. With a bit of compression and optimization, the problem was easily solved.
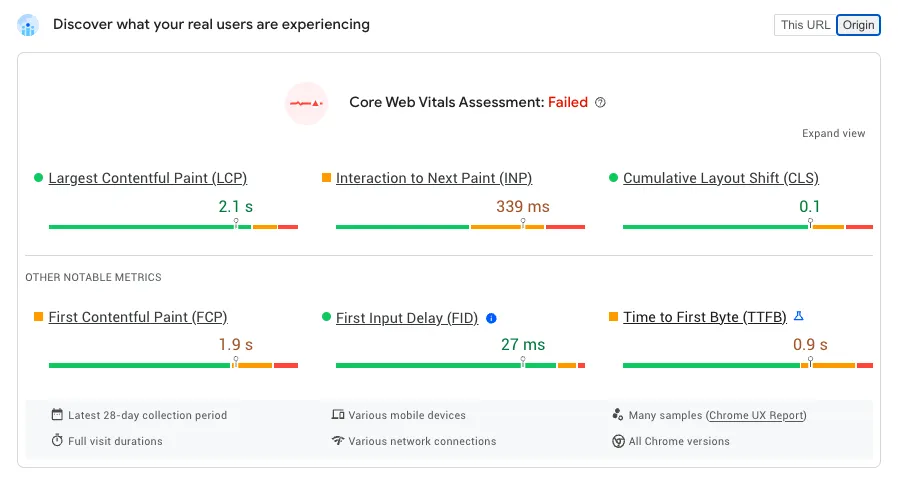
There are countless examples of all the things that could go wrong, and causing Core Web Vitals issues is rarely intentional. In automotive, specifically, it’s often an afterthought or flat-out ignored. Performance implications exist for every third-party plugin, Google Tag Manager container, or Google Analytics tag. The reality is that most website vendors (in or out of automotive) need to be better equipped to monitor these issues and resolve them.
So, what is my low Performance score on PageSpeed Insights actually telling me?
PageSpeed Insights can be incredibly useful in identifying problems specific to your third-party vendors or the website provider itself. More often than not, it’s a combination of both. That’s why Overfuel is focused on website performance and optimizing the top of the funnel rather than overcrowding the middle of the funnel with pop-ups and third-party plugins.
#1 offender: third-party scripts (especially multiple Google Analytics or Google Tag Manager tags)
For every Google Tag Manager (GTM) container on a website, the loading time is slowed by ⅓ of a second. It may not seem like much, but every second counts when it comes to conversion. There’s endless research showing significant drops in conversion rates for every second it takes a website to load, so we won’t spend much time rehashing that. However, we’ve seen automotive websites with over twelve instances of Google Tag Manager. That’s nearly 4 seconds of additional load time!
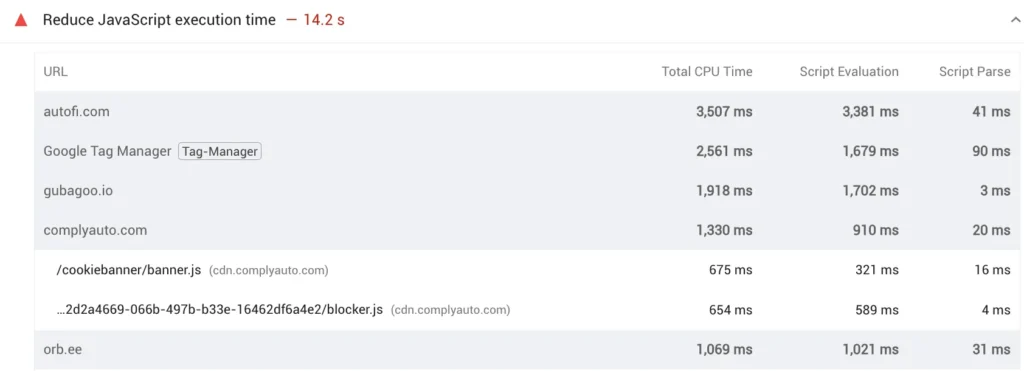
Again, this is rarely intentional, so it’s important for dealerships to have a dedicated success manager who monitors these things, provides feedback, and follows best practices.
Your website contains unoptimized images, videos, custom fonts, etc.
Dealerships are not alone in this problem; even large syndication websites like Cars, CarGurus, etc., have yet to adopt lossless image compression for vehicle photos. Uncompressed images are a consistent complaint across all dealership websites when reviewing their PageSpeed scores. Optimizing your homepage slides, service pages, etc., is low-hanging fruit for significant performance gains.
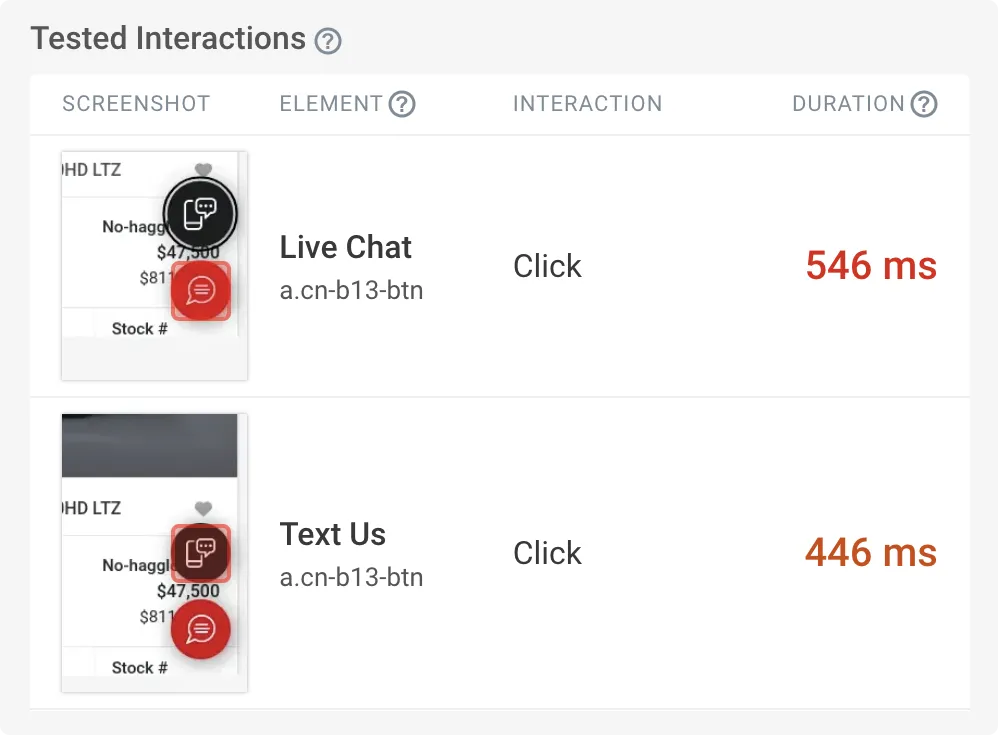
Live chat and pop-up forms are problematic for Interaction to Next Paint (“INP)
In March of 2024, a new Core Web Vitals metric came into play: Interaction to Next Paint, or INP for short. INP is the first metric that places additional scrutiny on third-party plugins like pop-ups and live chat. Rather than measuring the initial website load, INP measures the engagement on a page after the page is loaded. Every form field, chat prompt, or pop-up is also being measured. If these plugins are ever so slightly slow, that impact can be measured directly from the INP scores. In other words, the third-party plugins a dealership chooses can undermine all other efforts to improve website performance.
TL;DR: Key takeaways dealerships can learn from PageSpeed Insights
- PageSpeed scores can be beneficial for diagnosing specific issues on specific pages. Still, more importantly, and most often overlooked, the most essential part of the Core Web Vitals Assessment is the “Origin” tab and how the entirety of your website is being impacted. Minor issues can often cause significant problems if undiagnosed or ignored.
- The Assessment is more critical than the Performance score. The Performance score is based on “lab” data (simulated, not actual user data), whereas the Assessment is based on “field” data (real-world, CrUX data across a ton of users)
- Passing Core Web Vitals is more within a dealership’s control than they think. Some website vendors are better than others at optimizing around third-party plugins and making their best effort to mitigate the performance risks. The bottom line is that Core Web Vitals issues can no longer be ignored when trying to reach modern, mobile-first car shoppers.
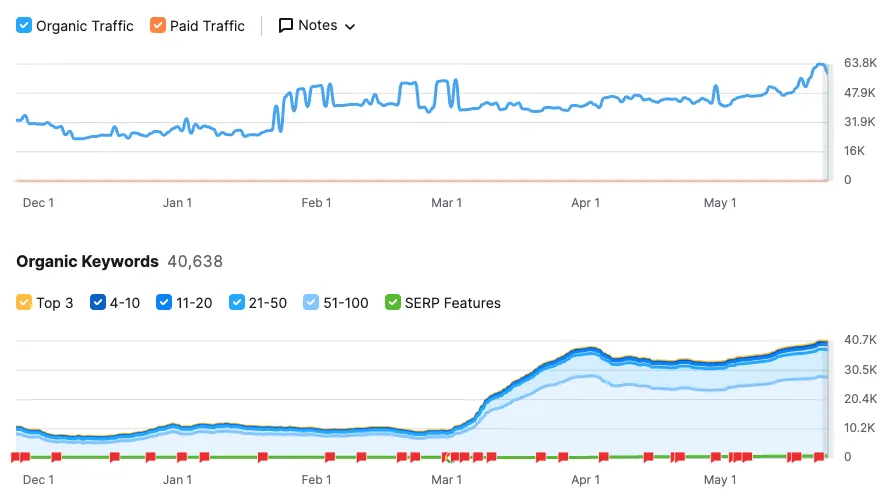
Long-term, dealerships benefit immensely by passing Core Web Vitals. We regularly see 2-4x increases in organic search traffic, which is free growth. This client boosted organic keywords by 322% and organic traffic by 154% over the course of 90 days.
If you haven’t run your website on PageSpeed Insights, we strongly encourage you to do so. If you’d be interested in a mobile-first website platform built specifically to meet modern speed standards and pass Core Web Vitals, let’s talk.